Essay
Share out the billionaires’ wealth: how much would each person get, once or every year?
Contents
Forbes’s 2026 World’s Billionaires list counts a record 3,428 billionaires, with a combined net worth of $20.1 trillion at stock prices and exchange rates of 1 March 2026.1 The World Bank puts the world’s population in 2025 at 8.22 billion.2 Divide one by the other and every person on Earth would get about $2,450, once.
Spread over twelve months, that is $204 a month for one year, and then nothing. Wealth is a stock, not a flow: once it is handed out, it is gone. A payment that comes every year has to come out of what the wealth earns, or a set share of it. At 2% a year that would be $49 per person ($4.08 a month); at 5%, $122 ($10.19 a month).
| How it is paid | Per person | Per month |
|---|---|---|
| All of it, once | $2,450 | $204 for 12 months |
| 2% of it every year | $49 a year | $4.08 |
| 5% of it every year | $122 a year | $10.19 |
Once: about $2,450 each
The average fortune on the list is $5.8 billion, and 20 people are worth $100 billion or more. The richest, Elon Musk, at an estimated $839 billion, would on his own come to about $102 for every person in the world.1
At 2025 average exchange rates from the World Bank data this site uses, $2,450 is about €2,170, £1,860, ¥366,000 or ₹214,000.3
How far would it go? This site’s 211-country comparison uses the World Bank’s poverty line of $3.00 a day as its standard amount, converted into each country’s prices.4 Paying that to everyone in those 211 countries and territories (8.12 billion people) for a year would cost about $3.95 trillion at market exchange rates.3 The billionaires’ $20.1 trillion would pay for about 61 months of it: a little over five years.
Every year: what the wealth could pay without running out
To pay something every year without using up the wealth, only part of it can go out each year. We show three rates. None is a forecast; each is a yardstick that already exists somewhere.
2% is the rate in the minimum tax on billionaires that the economist Gabriel Zucman set out in a 2024 report commissioned by Brazil’s G20 presidency. It would apply only to those not already paying the equivalent in income tax, which is why the report estimated $200–250 billion a year rather than 2% of the whole. The same report puts billionaires’ effective tax rate at 0.3% of their wealth.5
5% is the share of their investment assets that US private foundations must pay out each year,6 and the yearly draw that Alaska’s Permanent Fund, the fund behind Alaska’s dividend, makes for the state.7 7.5% is the report’s figure for the average real return, before tax, on the wealth of the very rich over the last four decades;5 paying out all of it would leave nothing to grow.
| Paid out each year | Total a year | Per person a year | Per person a month | Share of $3 a day for everyone |
|---|---|---|---|---|
| 2% | $402 billion | $49 | $4.08 | 10% |
| 5% | $1.0 trillion | $122 | $10.19 | 25% |
| 7.5% | $1.5 trillion | $183 | $15.29 | 38% |
As a yearly payment, then, the billionaires’ wealth would cover between a tenth and about a third of a $3-a-day floor for everyone, and only as long as the wealth kept earning at least what was paid out. In local money, 5% a year is about €9.00, ¥1,530 or ₹890 a month per person.3
Why the one-off figure is smaller in practice
Forbes values each fortune from stakes in public and private companies, real estate, art, yachts and other assets, minus known debt.1 Most of it is not cash. Much of it is founders’ shares in companies they control, and selling a large block of shares tends to push the price down; selling them all at once would mean selling far more than markets usually absorb. Stakes in private companies have no market price at all.
The figures also move. They are a snapshot of 1 March 2026, and Forbes notes that some fortunes changed by billions within days of it.1 The $2,450 is a figure on paper: an upper bound, not cash that could be handed out.
Country by country
Forbes counts billionaires by citizenship, not by where they live; the 3,428 come from 80 countries and territories.18 We added up the list’s entries for each country9 and divided by that country’s population from the data behind this site’s calculator.3 The table also shows how many months the wealth would pay everyone in that country $3.00 a day (the poverty line in local prices, as in the comparison), and what share of a year of that payment 5% of the wealth would cover each year. These are the 25 largest totals.
| Country (citizenship) | Billionaires | Combined wealth (US$ billion) | Per person, once (US$) | Months of $3 a day for everyone | 5% a year pays |
|---|---|---|---|---|---|
| World | 3,428 | 20,100 | 2,450 | 61 | 25% |
| United States | 991 | 8,431 | 24,280 | 267 | 111% |
| China | 539 | 2,175 | 1,540 | 35 | 14% |
| India | 229 | 1,019 | 700 | 34 | 14% |
| Germany | 212 | 1,016 | 12,090 | 162 | 68% |
| Russia | 149 | 653 | 4,550 | 136 | 57% |
| France | 53 | 628 | 9,140 | 121 | 50% |
| Italy | 90 | 484 | 8,210 | 123 | 51% |
| Canada | 82 | 457 | 10,980 | 128 | 53% |
| Hong Kong | 71 | 420 | 56,020 | 824 | 343% |
| United Kingdom | 57 | 300 | 4,320 | 51 | 21% |
| Spain | 44 | 281 | 5,870 | 94 | 39% |
| Switzerland | 44 | 278 | 30,620 | 262 | 109% |
| Mexico | 24 | 267 | 2,030 | 39 | 16% |
| Brazil | 70 | 265 | 1,240 | 29 | 12% |
| Australia | 56 | 249 | 9,020 | 107 | 45% |
| Japan | 44 | 229 | 1,860 | 30 | 12% |
| Sweden | 50 | 225 | 21,200 | 257 | 107% |
| Indonesia | 35 | 211 | 740 | 26 | 11% |
| South Korea | 50 | 197 | 3,820 | 68 | 28% |
| Israel | 41 | 196 | 19,380 | 203 | 84% |
| Singapore | 55 | 156 | 25,480 | 358 | 149% |
| Czechia | 12 | 102 | 9,400 | 158 | 66% |
| Thailand | 22 | 100 | 1,400 | 47 | 20% |
| Türkiye | 40 | 92 | 1,070 | 26 | 11% |
| Greece | 21 | 90 | 8,660 | 145 | 60% |
Per person, Hong Kong stands out: its 71 billionaires hold $420 billion among 7.5 million people, about $56,020 each. Switzerland ($30,620), Singapore ($25,480), the United States ($24,280) and Sweden ($21,200) follow. In these five places, 5% a year of their billionaires’ wealth would pay more than a full year of $3 a day for everyone.
At the other end, in India ($700 per person), Indonesia ($740), Türkiye ($1,070), Brazil ($1,240) and China ($1,540), the wealth would pay the poverty line for two to three years, and 5% a year would cover 11–14% of it. Japan’s 44 billionaires, worth $229 billion, come to $1,860 per person (about ¥279,000): 30 months of the ¥9,400 poverty line, or 9 months of the ¥30,000 that Japan’s calculator page starts from.
In small places a few people make a large difference: Cyprus (10 billionaires, 1.4 million people), Monaco (2) and St Kitts and Nevis (2) get very large per-person figures, but they are outside the top 25. Taiwan (66 billionaires, $245 billion) is not in the World Bank data this site uses, so it has no row.8 And 133 of the 211 countries and territories in our data have no billionaire citizen on the list at all; 1.67 billion people live in them.
What the numbers show
Shared out once, the billionaires’ wealth comes to about $2,450 per person: about five years of a $3-a-day floor worldwide at market exchange rates, before any fall in prices from selling. As a yearly payment it is much smaller: $49 to $183 per person a year at the rates above, a tenth to about a third of that floor. How far a country’s own billionaires would go varies widely, from more than a full year in five of the 25 places in the table to about an eighth in Japan and Brazil.
For what a basic income would cost in each country and how that compares with tax revenue, see the world map and the 211-country comparison; to try other amounts, the calculator. On paying for a basic income from AI and capital, see universal high income: who pays?.
Assumptions and limits
A snapshot. Net worths are Forbes’s estimates as of 1 March 2026, not audited figures, and they change daily.1 Summing the list’s entries gives $20.05 trillion; Forbes rounds the total to $20.1 trillion, which we use for the world figures. The online list we summed gives slightly different counts for a few countries than Forbes’s launch article, for example 991 for the United States against 989.89
Citizenship, not residence. Forbes assigns each billionaire to a country of citizenship.8 Some live elsewhere, so a country’s row is not the wealth located in that country.
Gross, before tax and costs. Taxes on selling assets, the cost of making the payments and any effect on prices or behaviour are left out.
Prices and exchange rates. The $3.00 a day is the World Bank’s poverty line in 2021 PPP dollars, converted into local prices as in the comparison. Summed at market exchange rates it costs $3.95 trillion a year, less than $3.00 × 365 × the population, because prices are lower in poorer countries.34 Local-currency amounts use 2025 average exchange rates implied by World Bank GDP data.3
Populations. World population is the World Bank’s 2025 figure.2 Country populations are those in the site’s data: mostly World Bank figures for 2025, with official national figures for seven featured countries (for Japan, the October 2026 estimate).3
Not a proposal. The rates are yardsticks, not policies we propose, and nothing here says whether wealth should be taxed or shared out. The numbers only show the size of the sums.
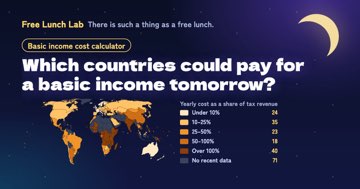 World map: the cost against tax revenue →
Run the numbers
United States · China · India · Germany · Japan · Hong Kong · All 211 countries and territories compared
Related essays
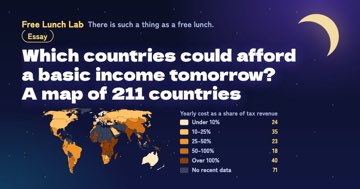 Which countries could afford a basic income tomorrow? A map of 211 countriesWe set the cost of paying everyone $3.00 a day against each government’s tax revenue. 24 countries could do it with under 10%; 40 would need more than all of i…
 Universal high income: who pays?Elon Musk says AI will bring a “universal high income”. Who pays, and through what pipe? Altman’s American Equity Fund, the Windfall Clause, Alaska’s dividend,…
 When an AI company sets aside shares: Anthropic’s Public Benefit Fund and basic incomeAnthropic commits 5% of its shares to a fund that may make direct distributions to specific populations. Is it basic income? BIEN’s test, Alaska, basic shares.
 Does giving people money make them stop working? What the experiments foundTen studies side by side, from 1970s US trials to Kenya, Alaska and 101 US pilots. Most found small cuts in work or none; none found people quitting en masse.
 ¥70,000 a month for everyone: who gains and who loses? Heizo Takenaka’s basic income plan, worked out for five householdsHeizo Takenaka’s 2020 idea of ¥70,000 a month for all, worked out for five Japanese households under stated assumptions, plus what it would cost the country.
Free Lunch Quiz
What type are you?
5 questions, 30 seconds, no sign-up
Sources
- Forbes — Chase Peterson-Withorn, “Inside Forbes’ 2026 Billionaires List: More Than 3,400 Worth $20 Trillion” (10 March 2026, updated 18 March 2026): 3,428 billionaires, $20.1 trillion, average $5.8 billion, 20 worth $100 billion or more, 80 countries and territories, stock prices and exchange rates of 1 March 2026, methodology ↩
- World Bank — Population, total (SP.POP.TOTL), World, 2025: 8,215,424,893 ↩
- Free Lunch Lab — countries.json: population, GDP in local currency and US dollars, and the cost of the $3.00-a-day poverty line for 211 countries and territories (CC BY 4.0) ↩
- World Bank — June 2025 update to the global poverty lines: the international poverty line of $3.00 a day in 2021 PPP ↩
- Gabriel Zucman, EU Tax Observatory — A Blueprint for a Coordinated Minimum Effective Taxation Standard for Ultra-High-Net-Worth Individuals, executive summary (25 June 2024): a 2% minimum tax, $200–250 billion a year from about 3,000 billionaires, 7.5% average real pre-tax return, 0.3% effective tax rate ↩
- IRS — Private foundations: minimum investment return (5% of the fair market value of non-charitable-use assets) ↩
- Alaska Permanent Fund Corporation — Understanding the Fund: the percent of market value draw, set in statute at 5.0% ↩
- Forbes — Sam Ellefson, “The Countries With The Most Billionaires 2026” (11 March 2026): billionaires are counted by citizenship; United States 989, China 539, India 229, Germany 212, Russia 147; Taiwan 66 worth $245 billion ↩
- Forbes — World’s Billionaires List 2026, every entry’s net worth and country of citizenship (retrieved 14 November 2026); our totals by country are in data/billionaires-2026.json · github.com ↩