Essay
Does giving people money make them stop working? What the experiments found
Contents
- The evidence side by side
- The 1970s: negative income tax and Mincome
- Recent trials: Finland, Stockton and OpenResearch
- 101 US pilots: what the evaluations say
- Beyond rich countries: Kenya, Iran and seven programmes
- Alaska: a payment to everyone, every year
- Who worked less, and what they did instead
- Why a pilot is not a national basic income
- What we still do not know
- What to take from it
“Give people money for nothing and they’ll stop working.” It is the most common objection to basic income, and a fair question. It is also one that can be checked. For more than fifty years, governments, charities and researchers have handed out cash and measured what happened to work.
We lined up the main studies: the US negative income tax experiments of the 1970s, Canada’s Mincome, Alaska’s dividend, Iran’s national cash transfers, a reanalysis of seven government programmes in six countries, Finland, GiveDirectly’s long-term study in Kenya, Stockton, OpenResearch, and the 101 pilots in our table of US guaranteed income pilots. Every figure comes from the papers and official reports, or from our earlier essays on OpenResearch and Finland.
| Worked less | No clear change | Worked more | |
|---|---|---|---|
| SIME/DIME (negative income tax)USA, 1970sHours down 9–20% | Worked less | ||
| MincomeCanada, 1975–79Hours down 1–3% | Worked less | ||
| Alaska dividendUSA, since 1982Part-time work up | No clear change | ||
| Iran cash transfersSince 2011More work by women | No clear change | ||
| Seven government programmesSix countriesNo systematic effect | No clear change | ||
| Finland2017–18Year 2: +6 days | No clear change | ||
| Kenya (GiveDirectly)Since 2018From wages to own business | No clear change | ||
| Stockton (SEED)2019–21Not significant | No clear change | ||
| OpenResearchUSA, 2020–231.3 hours a week less | Worked less | ||
| US pilots with a control group17 evaluationsNumber of pilots | 2 | 7 | 8 |
Each dot is a study’s main result on work. The columns show direction, not size: the studies measure work in different units (hours, days, employment rates), so the sizes are in words. For the US pilots, the numbers count evaluations with a control group in each column; one more found people moving between kinds of work.
The evidence side by side
One distinction runs through everything below. “No significant effect” does not mean “no effect”. It means the gap between recipients and the control group was too small, given the noise in the data, to tell apart from chance. A small study can miss a real effect. A large one can rule out big effects but not small ones. Where a paper says what it can rule out, we say so.
| Program | Place and years | Payment | Design | Effect on work | Source |
|---|---|---|---|---|---|
| SIME/DIME (negative income tax) | Seattle and Denver, USA; from 1970, for 3 or 5 years | A guaranteed $3,800–$5,600 a year for a family of four (1971 dollars), reduced as other income rose | Randomised; about 4,800 families | Annual hours down about 9% for husbands, 20% for wives and 14% for single mothers (second year) | 9 |
| Mincome | Dauphin and Winnipeg, Canada; payments 1975–1979 | An income floor, reduced by 50 cents for each dollar of other income; anyone in Dauphin could claim it | Field experiment; the whole town of Dauphin was eligible | Hours down about 1% for men and 3% for married women | 1011 |
| Alaska Permanent Fund Dividend | Alaska, USA; since 1982 | A yearly dividend for every resident: on average $1,495 per person (2010 dollars) | Alaska compared with a weighted mix of other states, 1977–2014 | No effect on employment; part-time work up 1.8 points (17%) | 8 |
| National cash transfers | Iran; from 2011 | Monthly deposits to more than 70 million people, worth 28% of median income per person | Panel data on when and how much households received (not randomised) | No reduction in hours or labour force participation; more work by women and self-employed men | 12 |
| Seven government cash transfer programmes | Honduras, Indonesia, Mexico (two), Morocco, Nicaragua, the Philippines | Cash for poor households | Reanalysis of 7 randomised trials | No systematic effect on whether, or how much, men or women worked | 13 |
| Basic income experiment | Finland; 2017–2018 | €560 a month for two years, tax-free | Randomised; 2,000 unemployed people vs other unemployed people | Year 1: 49.64 vs 49.25 days in work; year 2: about 6 more days | 56 |
| GiveDirectly long-term UBI | Siaya and Bomet, Kenya; from 2018, for 12 years | $0.75 a day per adult, paid monthly | Randomised by village: 44 villages (about 5,000 people) vs 100 control villages | Total hours unchanged; less wage work, more self-employment (after about two years) | 7 |
| SEED | Stockton, USA; 2019–2021 | $500 a month for two years | Randomised; 131 vs 200 | Differences in employment not significant | 2 |
| Unconditional Cash Study (OpenResearch) | Illinois and Texas, USA; 2020–2023 | $1,000 a month for three years | Randomised; 1,000 vs 2,000 who got $50 a month | About 1.3 fewer hours a week; 2.3 points less likely to be employed | 34 |
| 101 guaranteed income pilots | Across the USA; since 2018 | Median $500 a month | 18 evaluations with a control group report on work | 8 more work, 7 no clear difference, 2 less work, 1 a shift between kinds of work | 1 |
The 1970s: negative income tax and Mincome
Between 1968 and 1980 the US and Canadian governments ran five negative income tax experiments.10 A negative income tax is not quite a basic income. It guarantees a minimum and then takes part of it back as other income rises, typically around 50 cents per dollar in these experiments. So they tested cash and a high tax on earnings at the same time.
The largest, in Seattle and Denver, enrolled about 4,800 families. Measured in the second year, husbands worked about 9% fewer hours than the control group, wives about 20% and single mothers about 14%.9 Most of the husbands’ reduction came from longer unemployment, on average about 2.2 more weeks out of work; for wives and single mothers it was time out of the labour force.9 Averaging the four US experiments, three reviews put the reduction for main earners at 5% to 7.9%. One of them, by Philip Robins (1985), found that “in no case is there evidence of a massive withdrawal from the labor force”.10
Canada’s Mincome, in Manitoba, made the town of Dauphin a “saturation site”: every resident could claim the guarantee. Families enrolled from late 1974, and payments ran until 1979.11 Derek Hum and Wayne Simpson’s analysis of work (1993) found hours down about 1% for men and 3% for married women, smaller than in the US.10 Mincome is better known for Evelyn Forget’s 2011 finding that hospitalisations in Dauphin fell by 8.5% relative to a comparison group; a 2021 reanalysis by David Green argues that, once earlier trends are taken into account, the data do not support that conclusion.11
Recent trials: Finland, Stockton and OpenResearch
Finland paid €560 a month, tax-free, to 2,000 randomly chosen unemployed people for two years. In the first year, recipients were in work for 49.64 days on average and the control group for 49.25: no effect.5 Over roughly the second year, recipients worked about 6 days more. But a new “activation model” for the unemployed began that year and did not affect the two groups in the same way, so the second-year gap cannot all be credited to the basic income.6 Our essay on Finland has the details.
Stockton’s SEED paid $500 a month for two years. A first-year report in 2021 said full-time work rose from 28% to 40% among recipients, and that figure is still widely quoted. The peer-reviewed analysis of the randomised trial (Journal of Urban Health, 2023; 131 recipients, 200 controls) found that the differences in employment were not statistically significant, before the pandemic or during it.2
OpenResearch’s study, backed by Sam Altman, is the largest and most carefully measured. 1,000 people aged 21 to 40 received $1,000 a month for three years; 2,000 received $50 a month. Recipients worked about 1.3 hours a week less than the control group, were 2.3 percentage points less likely to be employed, and earned about $1,900 a year less from work. The authors call it a 5 to 6% decline, “a moderate effect”.3 Employment still rose in both groups, from 58% to 72% among recipients and from 59% to 74% in the control group.4 Our essay on the study covers the rest.
101 US pilots: what the evaluations say
Our table of US guaranteed income pilots lists 101 programmes; the median pays $500 a month. 53 have a published evaluation, and 34 of those compared recipients with a control or comparison group. 18 of the 34 report a result on work.1
Eight found more work than in the control group. In Oakland, full-time employment rose from 15% to 26% among recipients and from 14% to 18% in the control group; in Cambridge, Massachusetts, it rose from 36% to 40% while it fell from 30% to 28%. Arlington, Columbia, Durham and Denver reported similar results, and Baltimore’s recipients missed about 9 fewer hours of work a month. In Los Angeles County’s programme for young adults, employment rose 7 points, though the author credits much of that to the job training that came with the cash.1
Seven found no clear difference, Stockton among them. Two found less work: OpenResearch, and Compton, where labour force participation fell 13 points among people who had worked part-time, while full-time workers did not change. One, for artists in New York, found about 3.9 more hours a week on art and 2.4 fewer on other work.1
These are not 18 equal pieces of evidence. Many are short reports rather than peer-reviewed papers, samples are often 100 to 200 people, several give percentages without saying whether a difference is statistically significant, and some came with other services. The count shows the range of results, not a verdict. What it does not show is people dropping out of work.
Beyond rich countries: Kenya, Iran and seven programmes
GiveDirectly’s study in Kenya is the closest thing so far to a long-term basic income. In 44 villages, every adult receives $0.75 a day, paid monthly, for 12 years; 100 villages serve as controls, alongside villages paid for two years or in a lump sum.7 After about two years, total household working hours had not fallen. The estimate was a small increase that was not significant, and the authors “can reject large decreases”. What changed was the kind of work: fewer hours of wage work in farming and more in non-farm self-employment, as people started or expanded small businesses. Wage workers from outside the villages filled the gap, and wages rose.7
Iran replaced energy subsidies with monthly cash deposits from 2011, reaching more than 70 million people and worth 28% of median income per person. Using differences in when households started receiving the money and how much it meant to them, Djavad Salehi-Isfahani and Mohammad Mostafavi-Dehzooei found “no evidence that cash transfers reduced labor supply”, and positive effects for women and self-employed men. In the working paper the exception was young people with weak ties to the labour market.12
Abhijit Banerjee, Rema Hanna, Gabriel Kreindler and Benjamin Olken went back to the data from seven randomised trials of government cash transfer programmes in Honduras, Indonesia, Mexico, Morocco, Nicaragua and the Philippines. They found “no systematic evidence that cash transfer programs discourage work”, for men or for women.13 These programmes were aimed at poor households; they were not basic incomes.
Alaska: a payment to everyone, every year
Every Alaska resident has received a yearly dividend from the state’s Permanent Fund since 1982. The average was $1,495 per person in 2010 dollars, or about $3,900 for a family.8 Damon Jones and Ioana Marinescu compared Alaska with a weighted mix of other states and found that the dividend “had no effect on employment” and raised part-time work by 1.8 percentage points (17%).8
They are careful about what that means. Their confidence intervals cannot rule out a positive effect on employment, so the extra part-time work may come from people moving from full-time to part-time, or from people joining the workforce part-time. Hours fell by less than one hour a week, and not significantly. Their explanation is that when everyone gets the money and spends it locally, demand for local services rises and offsets the pull towards working less; employment held up better in sectors serving local customers than in those trading with the rest of the world.8
Who worked less, and what they did instead
Where work fell, it fell for particular people. In the 1970s experiments it fell most for wives and single mothers, who worked fewer hours to begin with, so a few weeks off is a bigger percentage.10 Husbands mostly took longer between jobs.9 Young people cut their work by a large percentage but a small number of hours, and the official report notes that this did not come with more time in school.9
In OpenResearch, the drop was concentrated among people under 30, single parents and those with the highest household incomes at the start; for recipients over 30 there was no significant effect.4 The hours went mostly to leisure. The paper rules out even small changes in time spent on childcare, job search or self-improvement, though spells without work lasted about 0.8 months longer.3 In Kenya, people moved from wage work to their own businesses.7 In Alaska, some moved to part-time work.8 In Finland, Kela found that the basic income helped people who were already active, and did not solve the problems of those in the most difficult situations.6
OpinionSo the honest picture is not “nobody works less”. Some people do, by a few hours a week or a few weeks a year: mostly second earners and single parents, the young, and people between jobs. Whether that is a cost or the point depends on what you think that time is for.
Why a pilot is not a national basic income
Almost every study above differs from a real basic income in at least four ways.
How long it lasts. Most were temporary, and recipients knew when the money would stop. People may treat three years of cash differently from a payment for life. Alaska’s dividend is permanent but modest. Kenya’s 12-year group is the main test of a long commitment, and its published results cover the first two years.78
Who gets it. A pilot pays a few people in a place. A payment to everyone changes local demand, wages and prices: in Kenya wages rose as people left wage work, and in Alaska the effect on the local economy seems to have offset the individual one.78 A pilot that pays a few hundred people cannot see this.
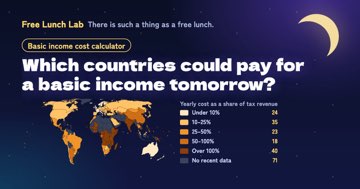
Who pays. In a pilot the money comes from outside. A national basic income has to be paid for, mostly through taxes, and higher taxes on earnings can themselves reduce work. The negative income tax experiments did take back about 50 cents per dollar earned, one reason their effects were larger; Finland’s experiment changed no taxes at all.610 For what a basic income would cost, see our world map.
Who was studied. Most samples were people on low incomes, who respond more because the payment is large next to their earnings. A simulation for the Gary experiment estimated that a national programme would reduce work by about a third as much (1.6% rather than 4.5%).10
What we still do not know
No one has yet paid a permanent, universal basic income at a level people could live on, funded by taxes, and measured what happened to work. The evidence covers pieces of that: permanence with little money (Alaska), money without permanence (most pilots), everyone in a village (Kenya), and national scale with a targeted design (Iran, the seven programmes).
Many pilot results rest on self-reported surveys. Estimates also move as better data arrive: OpenResearch’s were revised upward in 2026 once state unemployment-insurance records were added.3 And “no significant effect” from a study of 300 people is a far weaker claim than the same words from a study of 3,000.
What to take from it
OpinionAcross more than fifty years of experiments, in rich countries and poor ones, no study found that cash makes people stop working. Most found small reductions or none, and some found more work. Where work fell, it fell by hours a week or weeks a year, mostly for parents, the young and people between jobs.
That is not the same as “basic income has no effect on work”. OpenResearch and the 1970s experiments measured real, if modest, reductions, and those numbers belong in any honest costing. The better question is not “will people stop working?” but “how much less, who, and is it worth it?” The data answer the first two parts. The third is a judgement for each of us.
 World map: the cost against tax revenue →
Run the numbers
United States · Canada · Finland · Kenya · Iran · 101 guaranteed income pilots in the United States · All 211 countries and territories compared
Related essays
 What happened when Sam Altman’s study gave people $1,000 a month for three years1,000 people got $1,000 a month for three years. They worked a little less, spent on basics and some bought time. What the papers found, and what they don’t.
 Did Finland’s basic income experiment fail? What it showed, and what it could not“Finland already tried basic income and it failed.” The 2018 headlines, the results, the limits and Finland in 2026, from the sources: neither a failure nor a…
 Has generative AI taken our jobs? The data, and what basic income can do (Part 1)AI was cited in 121,401 US job cuts in 2026, but overall employment shows no clear AI footprint. The entry door is narrowing.
 Which countries could afford a basic income tomorrow? A map of 211 countriesWe set the cost of paying everyone $3.00 a day against each government’s tax revenue. 24 countries could do it with under 10%; 40 would need more than all of i…
Free Lunch Quiz
What type are you?
5 questions, 30 seconds, no sign-up
Sources
- Free Lunch Lab — us-pilots.json: 101 US guaranteed income pilots with their evaluations (CC BY 4.0; table at /pilots/us/) ↩
- Stacia West and Amy Castro — Impact of Guaranteed Income on Health, Finances, and Agency: Findings from the Stockton Randomized Controlled Trial (Journal of Urban Health 100(2), 2023) ↩
- Vivalt, Rhodes, Bartik, Broockman, Krause and Miller — The Employment Effects of a Guaranteed Income: Experimental Evidence from Two U.S. States (NBER w32719, Jul 2024, revised Aug 2026) ↩
- OpenResearch — Key Findings: Employment (21 Jul 2024) ↩
- Ministry of Social Affairs and Health, Finland — Preliminary results of the basic income experiment: self-perceived wellbeing improved during the first year, no effects on employment (8 Feb 2019) ↩
- Kela — Finland’s Basic Income Experiment 2017–2018: results (2020; PDF); Ministry of Social Affairs and Health and Kela, final results release (6 May 2020) · stm.fi ↩
- Abhijit Banerjee, Michael Faye, Alan Krueger, Paul Niehaus and Tavneet Suri — Universal Basic Income: Short-Term Results from a Long-Term Experiment in Kenya (15 Sep 2023; PDF) ↩
- Damon Jones and Ioana Marinescu — The Labor Market Impacts of Universal and Permanent Cash Transfers: Evidence from the Alaska Permanent Fund (American Economic Journal: Economic Policy 14(2), 2022; PDF) · nber.org ↩
- US Department of Health and Human Services (ASPE) — Overview of the Final Report of the Seattle-Denver Income Maintenance Experiment (1983) ↩
- Karl Widerquist — The Negative Income Tax Experiments of the 1970s (early version of ch. 15 of the Palgrave International Handbook of Basic Income; PDF), Table 2 summarising Robins (1985), Burtless (1986), Keeley (1981), Moffitt (1979) and Hum and Simpson (1993) ↩
- David A. Green — A Reanalysis of ‘The Town with No Poverty: The Health Effects of a Canadian Guaranteed Annual Income Field Experiment’ (5 Mar 2021; PDF) ↩
- Djavad Salehi-Isfahani and Mohammad H. Mostafavi-Dehzooei — Cash transfers and labor supply: Evidence from a large-scale program in Iran (Journal of Development Economics 135, 2018); ERF Working Paper 1090 (2017) · erf.org.eg ↩
- Abhijit Banerjee, Rema Hanna, Gabriel Kreindler and Benjamin Olken — Debunking the Stereotype of the Lazy Welfare Recipient: Evidence from Cash Transfer Programs (World Bank Research Observer 32(2), 2017) · gsdrc.org ↩