Essay
Which countries could afford a basic income tomorrow? A map of 211 countries
Contents
Pay every resident the World Bank’s international poverty line, $3.00 a day, for one year. In seven places that would cost less than 1% of GDP: Monaco (0.38%), Liechtenstein (0.50%), Luxembourg (0.74%), Bermuda (0.77%), Ireland (0.84%), Singapore (0.86%) and Macao (0.89%). In three it would cost more than the whole economy produces in a year: Burundi (115% of GDP), DR Congo (133%) and Somalia (163%).18
GDP is not what a government can spend, though. So for every country we also set the cost against the government’s own tax revenue. Of the 140 countries and territories with a recent figure, 24 could pay for it with less than a tenth of their tax revenue. 40 would need more than all of it.
Tap or hover over a country to see its figures.
Yearly cost as a share of tax revenue
- Under 10%24
- 10–25%35
- 25–50%23
- 50–100%18
- Over 100% (more than all its tax revenue)40
- No recent data71
How the map is built
The cost is the population × $3.00 a day × 365 days: everyone, of every age, for one year. $3.00 is the World Bank’s international poverty line in 2021 purchasing power parity (PPP) dollars, set in June 2025.1 We convert it into local currency with the World Bank’s PPP conversion factor for household consumption, so that it buys roughly the same everywhere.6 For 34 countries and territories without a usable factor we use the market exchange rate instead. Population and GDP are World Bank figures, with national statistics for seven featured countries; GDP is for 2025 in 186 of the 211.23 The country shapes come from Natural Earth.9
Revenue is central government tax revenue as a share of GDP, from the World Bank.4 We take the latest year, and only if it is no more than five years older than the GDP year. Where tax revenue is missing we would use total revenue instead,5 but in this edition no country needed it. Of the 140 figures, 93 are for 2024, 19 for 2023, 8 for 2022, 9 for 2021 and 10 for 2020. Japan has no recent World Bank figure, so we use the tax and stamp revenue in its FY2026 national budget, ¥83.7 trillion.7
That leaves 71 countries and territories grey, home to 1.61 billion people: the World Bank has no tax figure for them since 2015, or only one more than five years old. They include Nigeria, Pakistan, Indonesia, Egypt, Vietnam, Iran, Qatar and Kuwait. Taiwan, North Korea, Eritrea, South Sudan and Yemen are not in the data at all. The full table, with every country’s figures and a link to its calculator page, is on the map page.8
| Cost as a share of tax revenue | Countries and territories | People living there |
|---|---|---|
| Under 10% | 24 | 0.35 billion |
| 10–25% | 35 | 1.18 billion |
| 25–50% | 23 | 0.70 billion |
| 50–100% | 18 | 1.71 billion |
| Over 100% | 40 | 2.57 billion |
| No recent data | 71 | 1.61 billion |
Patterns by region and income
Europe stands out. Of the 48 countries in Europe and Central Asia with a figure, 41 come in under 25% of tax revenue and 18 under 10%. The lowest shares anywhere are Luxembourg (2.6%), Macao (3.2%), Denmark (4.4%), Norway (4.5%) and Ireland (4.7%). At the other end, 25 of the 32 countries in Sub-Saharan Africa with a figure would need more than their whole tax take; only Mauritius (18%) and Botswana (24%) come in under 25%.
Latin America sits in the middle: 10 of its 19 countries with a figure fall between 25% and 50%, among them Mexico (30%), Brazil (31%) and Colombia (34%). In South Asia all six countries have a figure and none is under 10%. The Maldives (24%) is lowest; India and Nepal (both 132%) and Bangladesh (160%) would need more than all their central tax revenue.
Income explains most of this. Grouping countries by GDP per person in US dollars, from the same data (this is not the World Bank’s income classification): among the 55 with a figure and more than $15,000 per person, the median cost is 11% of tax revenue and 49 are under 25%. Between $5,000 and $15,000 the median is 31%; between $1,500 and $5,000 it is 114%. Below $1,500, 17 of the 18 countries with a figure would need more than all their tax revenue, and the median is 287%.
Two things push in the same direction. Among the countries with a tax figure, a poverty line in PPP dollars is a bigger slice of the economy where incomes are low: the median cost is 1.9% of GDP above $15,000 per person and 36% below $1,500. And poorer governments collect a smaller share of GDP in tax: the median is 19.9% above $15,000 and 12.6% below $1,500.
Notable cases
Japan: ¥9,400 a month per person, about ¥13.9 trillion a year, or 2.1% of GDP. Against the ¥83.7 trillion of tax and stamp revenue in the FY2026 national budget, that is 16.5%.7 Japan’s calculator page lets you try other amounts.
The United States: $91 a month, about $379 billion a year, 1.2% of GDP. Federal tax revenue was 10.8% of GDP in 2024, so the cost is 11.4% of it; state and local taxes are not counted.4
India: ₹1,800 a month, 9.2% of GDP. Central government tax revenue was 6.9% of GDP in 2022, the latest year, so the cost comes to 132% of it. India’s states raise taxes of their own, which this measure leaves out. Today’s cash schemes are far smaller; see our essay on Madhya Pradesh and cash for women.
Nigeria: 29,000 naira a month, 18.7% of GDP. The World Bank has no tax revenue figure for Nigeria since 2015, so it is grey on the map. Brazil: R$240 a month, 4.8% of GDP and 31% of tax revenue (2024). China: 320 yuan a month, 3.9% of GDP and 55% of central tax revenue, which was 7.0% of GDP in 2024; China’s childcare subsidy pays 3,600 yuan a year per child under 3.
The Gulf states are cheap relative to their economies: 1.1% of GDP in Qatar, 1.6% in Saudi Arabia and the United Arab Emirates, 1.8% in Bahrain, 2.1% in Kuwait and 2.7% in Oman. Against tax revenue they look very different, because most of their revenue is not tax. Saudi Arabia’s tax revenue was 8.1% of GDP in 2024 but its total revenue 26.8%, so the cost is 19% of tax revenue and 5.9% of all revenue.5 The UAE’s federal government reports tax revenue of 0.65% of GDP (2024), which puts the cost at 242% of it. Bahrain’s 2020 figure gives 63%; Qatar, Kuwait and Oman have no recent figure.
The big caveats
Gross, not net. These figures are the cheque, not the bill. A basic income would replace some existing benefits, and part of it would come back in tax. Neither is subtracted here.
PPP versus market prices. $3 a day at PPP is a different number of dollars at market exchange rates: about US$21 a month in India, US$12 in Syria and US$117 in Iceland and Switzerland. Where we had to use the exchange rate instead (34 places, among them Somalia and DR Congo), $3 a day means about US$90 a month, which is part of why those two top the chart.
A poverty line, not a living. $3.00 a day is the World Bank’s line for extreme poverty. In Japan it is ¥9,400 a month; the calculator’s own default for Japan is ¥30,000, and Takenaka’s proposal is ¥70,000. A basic income at ten times the poverty line costs ten times as much.
Weak tax collection. Tax revenue is not a hard limit: governments also borrow, earn from resources and state firms, and can raise taxes. But where much of the economy is informal and tax collection is weak, it is a fair sign of how much money a state can actually move. Ethiopia’s central government collected 3.4% of GDP in tax in 2024, Somalia’s 2.2%.
Central government only. The World Bank measure covers central government. Federal countries such as the United States, Germany, India, Brazil and the UAE, where states and regions also tax, look less able to pay than they are.
Old years. Ten countries’ tax figures are from 2020 and nine from 2021, while GDP is mostly for 2025; Burundi’s and the Central African Republic’s are from 2021 and DR Congo’s from 2022. We drop anything more than five years older than the GDP year, but even within that window a lot can change.
What it implies
For the poorest countries, a poverty-line basic income paid from their own taxes is out of reach; it would take money from outside. Transfers across borders already exist on a small scale: GiveDirectly’s study in Kenya pays adults a little over $20 a month.
Partial and phased schemes cost far less. Paying only India’s children, 29% of its people, would cost 2.7% of GDP, about 39% of central tax revenue. Try other groups and amounts in the calculator.
Resource funds are another route. Alaska’s Permanent Fund has paid an annual dividend from a state fund to eligible residents since 1982.10
OpinionOur read: the map does not say who will adopt a basic income. It says that for 59 countries, a floor at the extreme poverty line would cost less than a quarter of today’s tax revenue, so the obstacle there is a political choice rather than arithmetic. For 40, it cannot be paid from their own taxes alone. For more on what the evidence and the money look like, see Finland’s experiment, OpenResearch’s $1,000-a-month study and who would pay for a universal high income.
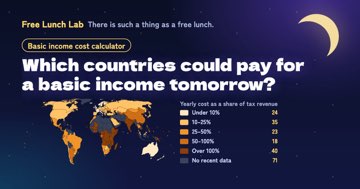 World map: the cost against tax revenue →
Run the numbers
Japan · United States · India · Nigeria · Brazil · Saudi Arabia · All 211 countries and territories compared
Related essays
 Did Finland’s basic income experiment fail? What it showed, and what it could not“Finland already tried basic income and it failed.” The 2018 headlines, the results, the limits and Finland in 2026, from the sources: neither a failure nor a…
 Basic income in India: the Madhya Pradesh experiment and today’s cash for womenWhat India’s 2011–2013 basic income pilot in Madhya Pradesh villages found, and how Ladli Behna, Ladki Bahin and PM-KISAN differ from it.
 China’s 3,600-yuan childcare subsidy: who gets it, and is it a basic income?China pays 3,600 yuan a year for every child under 3, with no income test. Who gets it, how it is paid, what it costs, and how close it is to a basic income.
 What happened when Sam Altman’s study gave people $1,000 a month for three years1,000 people got $1,000 a month for three years. They worked a little less, spent on basics and some bought time. What the papers found, and what they don’t.
 Universal high income: who pays?Elon Musk says AI will bring a “universal high income”. Who pays, and through what pipe? Altman’s American Equity Fund, the Windfall Clause, Alaska’s dividend,…
Free Lunch Quiz
What type are you?
5 questions, 30 seconds, no sign-up
Sources
- World Bank — June 2025 update to the global poverty lines: the international poverty line of $3.00 a day in 2021 PPP ↩
- World Bank — Population, total (SP.POP.TOTL) ↩
- World Bank — GDP, current local currency units (NY.GDP.MKTP.CN) and current US$ (NY.GDP.MKTP.CD) ↩
- World Bank — Tax revenue, % of GDP (GC.TAX.TOTL.GD.ZS), central government ↩
- World Bank — Revenue, excluding grants, % of GDP (GC.REV.XGRT.GD.ZS) ↩
- World Bank — PPP conversion factor, private consumption, LCU per international $ (PA.NUS.PRVT.PP) ↩
- Ministry of Finance Japan, explanation of the FY2026 budget. FY2026 initial budget: general-account spending ¥122.3092 trillion; social security ¥39.0559 trillion; taxes and stamp revenue ¥83.735 trillion ↩
- Free Lunch Lab — countries.json: population, GDP, government revenue and the cost of the $3.00-a-day poverty line for 211 countries and territories (CC BY 4.0) ↩
- world-atlas (Natural Earth, public domain) — the country shapes used for the map ↩
- State of Alaska, Permanent Fund Dividend Division — Historical timeline ↩